
The Java Virtual Machine (JVM) plays a critical role in the execution of Java applications, providing a layer of abstraction that allows Java programs to run on any platform without modification. Understanding the inner workings of the JVM is essential for developers, especially those working on high-performance applications where efficiency and resource management are key. For those undergoing full stack Java developer training, mastering JVM internals can greatly improve application performance and scalability. This blog delves into some of the crucial components of the JVM: class loaders, heap and stack memory management, and garbage collection (GC) tuning.
Class Loaders: Efficient Management of Java Classes
Class loaders in the JVM are responsible for dynamically loading Java classes into memory at runtime. This approach allows Java applications to load only the classes they need, rather than loading all classes upfront, thus conserving memory and improving performance. The JVM uses a hierarchical class loading mechanism, where each class loader can load classes independently or delegate the task to other loaders.
There are three main types of class loaders in the JVM:
- Bootstrap Class Loader: It loads the core Java libraries that are part of the Java runtime environment, such as classes in rt.jar.
- Extension Class Loader: It loads classes from the ext directory, which contains optional Java extensions.
- System/Application Class Loader: It is responsible for loading classes from the application’s classpath, where your application-specific classes are stored.
The efficiency of class loaders has a significant impact on the performance of Java applications. For instance, improper configuration or excessive class loading can lead to memory bloat or slower startup times. Developers, particularly those engaged, should understand how to optimize class loading to ensure that only required classes are loaded, thereby improving both memory utilization and application performance.
Heap and Stack Memory Management: Optimizing Memory Usage
In Java, memory management is divided into two main regions: the heap and the stack. Properly managing these memory areas is crucial for optimizing performance, especially for high-performance applications that need to process large volumes of data or handle numerous concurrent requests.
Heap Memory: Dynamic Memory for Objects
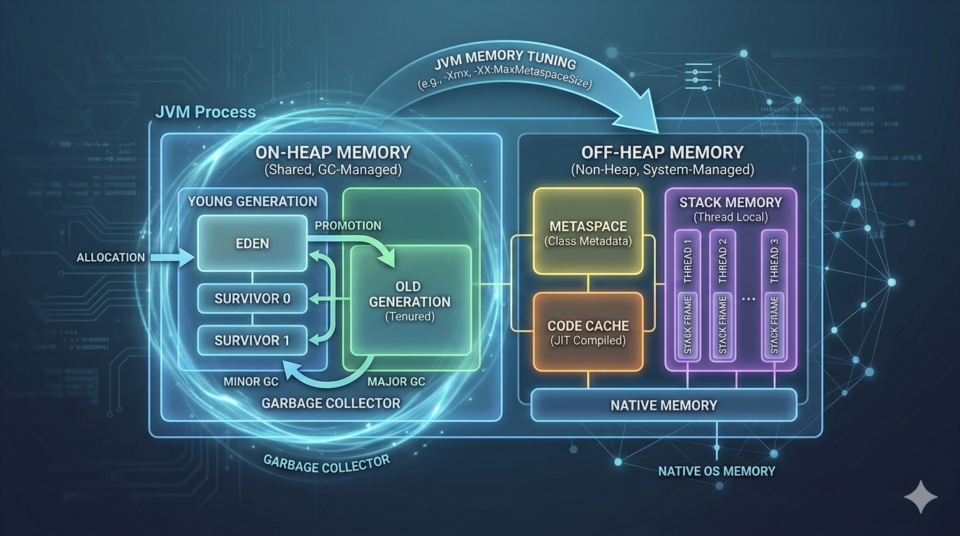
The heap is where Java objects are allocated, and it is divided into the young generation and the old generation. The young generation holds newly created objects, while the old generation contains long-lived objects that have survived multiple garbage collection cycles. Memory management in the heap is essential for minimizing garbage collection (GC) pauses, which can negatively affect the responsiveness of the application.
Developers can configure the heap size using JVM options such as -Xms (initial heap size) and -Xmx (maximum heap size). In real-time applications, tuning the heap size ensures that there is enough memory available without causing frequent GC cycles, which can introduce unnecessary pauses.
Stack Memory: Storing Local Variables and Method Calls
Each thread in Java has its own stack memory, where local variables and method calls are stored. The stack is automatically cleaned when a method call completes, making it a temporary storage area. Stack memory is generally used for primitive data types, method calls, and references to objects in the heap.
Stack memory can be adjusted using the -Xss JVM option, which defines the size of the stack for each thread. Over-allocation of stack memory can lead to a stack overflow, while under-allocation can cause memory shortages. Balancing stack memory allocation is important for maintaining application stability, particularly when dealing with recursive method calls.
Garbage Collection (GC) Tuning: Ensuring Optimal Performance
Garbage collection (GC) is the process by which the JVM reclaims memory from objects that are no longer in use, preventing memory leaks and ensuring that memory is available for new objects. However, excessive GC pauses can severely degrade application performance, especially in latency-sensitive applications. This is where garbage collection tuning becomes essential.
Types of Garbage Collectors
The JVM offers several garbage collectors, each optimized for different use cases:
- Serial Garbage Collector: Suitable for small applications or single-threaded environments, this collector uses a single thread to perform GC operations, which can cause long pause times.
- Parallel Garbage Collector: It uses multiple threads for GC, reducing pause times and improving throughput. This collector is ideal for multi-threaded applications with moderate memory requirements.
- G1 Garbage Collector: Designed for large applications, G1 GC splits the heap into regions and performs incremental garbage collection, offering more predictable pause times.
- ZGC and Shenandoah: These are low-latency garbage collectors designed to minimize pause times, making them ideal for real-time applications.
Tuning Garbage Collection for High-Performance Applications
Tuning garbage collection is critical to maintaining low-latency performance. Developers can choose the garbage collector that best suits their application’s requirements and adjust GC settings using JVM options like -XX:+UseG1GC for G1 GC or -XX:MaxGCPauseMillis=<time> to specify the desired maximum GC pause time. Proper GC tuning can significantly reduce the impact of garbage collection on application performance, especially for applications that handle large volumes of data or have high concurrency requirements.
In high-performance applications, developers often fine-tune GC settings to strike a balance between throughput and low latency. For instance, while G1 GC is well-suited for large heaps, applications requiring ultra-low latency might benefit from ZGC or Shenandoah.
Conclusion: Optimizing JVM Internals for High-Performance Applications
A deep understanding of JVM internals, including class loaders, memory management, and garbage collection tuning, is crucial for any developer looking to build high-performance Java applications. For those undergoing full stack Java developer training, this knowledge becomes even more critical as it helps developers optimize their applications for both scalability and responsiveness.
By mastering these JVM components, developers can troubleshoot performance bottlenecks, reduce memory usage, and fine-tune the JVM to meet the demands of modern, resource-intensive applications. Understanding the JVM is not just about writing code; it’s about building efficient systems that can perform well under pressure and scale seamlessly as demand increases.